Two people contacted me lately about an odd ethnicity in their DNA results. The three of us share ancestry in my grandfather's hometown, so they wondered if I'm seeing what they're seeing. I'm not, but I have a few curious results, too.
That's why I was excited to join another Diahan Southard webinar titled "DNA Ethnicity Estimates: How to Actually Use Them!" One of the most important things I learned was, basically:
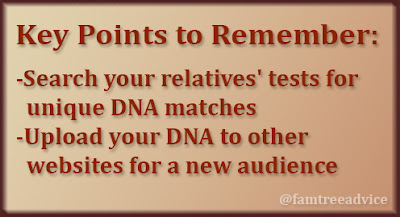
If your results show less than 5% of an unexpected ethnicity, it's probably not reliable.
 |
| Dig deeper into tiny, unexpected ethnicity results. |
Here's how to get a better idea of its reliability. I'll use AncestryDNA as an example, but most DNA websites have similar tools.
- Click on the unexpected ethnicity in your results. I chose my mother's unexpected 2% Portugal.
- This opens a panel that tells you a bit more, such as "Primarily located in Portugal; Also found in Spain." Their map tells me this ethnicity may cover Spain's whole west side.
- Now look at your percentage. In this case, it says 2% Portugal, but beneath that it says it "can range from 0% to 5%." That's right. It's as low as 0%.
I've documented my mother's ancestors in a small area of Southern Italy going back to the very early 1700s. Could someone have come from Spain or Portugal before that? Sure. And since FamilytreeDNA tells me I have 6% Iberian Peninsula, there probably is some ancient connection.
But that doesn't matter to my family tree, does it? I'll never make a documented connection to a centuries-old ancestor from Spain or Portugal.
My father's results have a laughable result of less than 1% Norway. Less than 1%! When I click it I see that his estimate is 0%, but it can range from 0% to 1%. That sounds like we can disregard it, don't you think? He has no Norway on MyHeritage.
In fact, all Mom and Dad's ethnicities but Southern Italy and Northern Italy could be as low as 0%. The same is true for me, with one exception. Even my Northern Italy could be as low as 0%.
AncestryDNA says the DNA samples they test you against "divide the world into 84 overlapping regions and groups." I can see that what they're calling Southern Italy and Northern Italy overlap close to the area we come from. Taken together, this makes me confident we are Southern Italy, going back at least as far as the paper records go.
But, if you *don't* know where all your people came from for the last 300+ years, pay attention to your unexpected results. They may be the clue you need.
A Range of Ethnicity Results
Why would AncestryDNA tell me my Northern Italy is 8% but it may range from 0 to 39%? This is from their website:
"We compare your DNA to a reference panel made up of DNA from groups of people who have deep roots in one region. We look at 1,001 sections of your DNA and assign each section to the ethnicity region it looks most like."
They look at 1,001 different sections of your DNA! Your DNA isn't one homogeneous strand. Each section can show a different percentage of an ethnicity. That means that my 1,001 test results for Northern Italian DNA ranged from none to a high of 39%. The average of all the tests was 8%.
Where the Action Is
For a long time my AncestryDNA results didn't show any of what they call Communities. Now I have three that either touch or overlap one another. And they are 100% true to my documented, massive family tree.
From Mom's side:
- Avellino & Southwest Foggia Provinces
- South Benevento & North Avellino Provinces
From Dad's side:
- Campobasso & East Isernia Provinces
I can prove that our documented ancestors are from the Benevento & Avellino Provinces. AncestryDNA bases these communities on the family trees of DNA matches. And they're very accurate, according to DNA expert Diahan Southard.
My husband's AncestryDNA test has a disappointingly low number of DNA matches. But I love his community! It fits everything we know about his ancestors: "Hiroshima, Yamaguchi, Fukuoka, Olta & Kumamoto." Here's what Ancestry says about how they determined this as his community:
"You, and all the members of this community, are linked through shared ancestors. You probably have family who lived in this area for years—and maybe still do."
I'll leave you with another great tip from Southard. Say you're trying to trace a close ancestor—a 2nd great grandparent or closer. And you have no idea where on earth they came from.
Do you have a DNA ethnicity that doesn't match what you know about your ancestry? Check your mystery DNA matches' ethnicities. (On AncestryDNA, Ethnicity is a tab, like Shared Matches.) Do any of these matches have a decent amount of that one unexpected ethnicity? Check their family tree and Shared Matches to see if their information that can help you.
Also, take a look at which ethnicities you actually share with your decent DNA matches. If they don't have small amounts of something you have, then that ethnicity has no bearing on your connection.
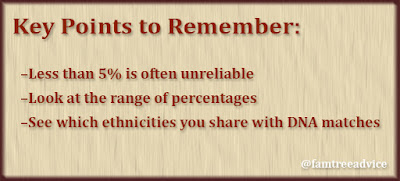 |
| Don't lose any sleep over tiny, unexpected DNA ethnicities. |
What's the bottom line with all these ethnicities?
- Be sure to check out the range of percentages. If it says it's as low as zero, it's may be too little to matter.
- If the average is below 5%, don't expect to find a documented ancestor from that part of the world.
- Check to see how your DNA matches' ethnic percentages compare to yours.
If some of your DNA ethnicity results simply don't make sense, give them a closer look. If you can see they're not worth pursuing, don't worry about them.
Here's a good way to look at it in mathematical terms:
- Each of your parents gave you 50% of your DNA.
- Each of your grandparents gave you 25% of your DNA.
- Each of your great grandparents gave you 12½% of your DNA.
- Each of your 2nd great grandparents gave you 6¼% of your DNA.
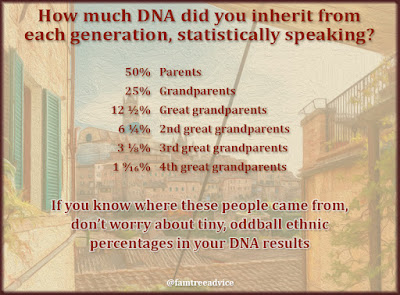 |
| A tiny percentage is either a statistical error or a very distant ancestor. |
I know exactly where all my 3rd great grandparents came from, as well as 55 of my 64 4th great grandparents. It's crazy to imagine that one of my nine missing 4th great grandparents walked to Southern Italy from Norway or Portugal! That gives me the confidence to ignore those trace ethnicities.
How about you?
