02 May 2023

Exploring Your Last Name Concentration

I recently made the comment that "I'm like the frozen concentrate of Benevento, Italy." In "Where Will Your Roots Map Take You?," I showed you how to create a map of all your ancestral locations.

Today's project focuses on your ancestral last name concentration. Granted, your name concentration depends on how much research you've done. But you may find some real surprises.
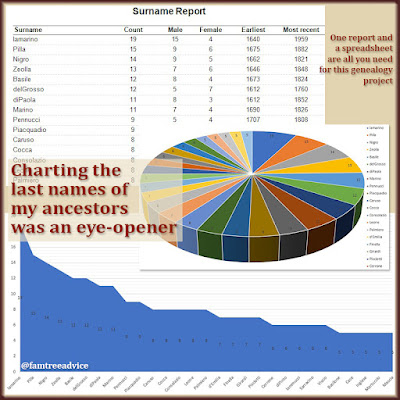
Let's look at 3 ways to discover which family names make up the biggest percentage of you. If you’d rather do it old school, you can pull the names from your family tree manually. But there's no reason you can't do option 2.

Once your ancestral last names are counted, Excel makes it easy to show your family tree composition in a colorful chart.

1. Family Tree Maker's Surname Report

After years of using Family Tree Maker (FTM), I've somehow never used the built-in Surname Report. To create yours:

  • Choose yourself in your family tree and click the Publish tab.
  • Under Person Reports, choose the Surname Report.
  • In the Report Options column, click Selected individuals.
  • You'll see your name highlighted, and you can choose the Ancestors option. But then you run into the problem of ancestors with more than one spouse. What if your ancestor isn't set as the preferred spouse? You may get step-grandparents in the list. I clicked the Filter In button because my ancestors all have a custom Ahnentafel fact. I clicked All facts, and Search where Ahnentafel Is not blank. With 401 people selected, I clicked Apply.
  • Now click the boxes in the report option tab for (1) Sort surname by count, and (2) Limit counts to included individuals.

You'll see an alphabetical list of all the last names of your direct ancestors. It shows how many times each name appears in your list of direct ancestors. And I love how it shows the earliest and most recent birth year of each name in this group.

You can save this report by clicking the Share button at the top-right of FTM and choosing Export to PDF. I recommend you also choose Export to CSV so you can make some charts and graphs from the data.

2. Family Tree Analyzer's Surname Chart

You can open any GEDCOM file with Family Tree Analyzer (FTA) and sort by relationship type to find your direct ancestors. But why not give it a GEDCOM that contains only the right people?

My Family Tree Maker File has a custom field that holds the Ahnentafel number of all my direct ancestors. It also has an Ahnentafel filter so I can display only this group. You can export a GEDCOM file of only the people found in any filter you've created. I created a direct-ancestor-only GEDCOM and opened it with FTA.

With your file open in FTA:

  • Click the Surnames tab and check only the Direct Ancestors box.
  • Click the Show Surnames button.
  • Click the top of the Individuals column to sort each surname from Z to A. (This is a numbers column, so it's really sorting from most to least.)

At the top of the report, you'll see the highest concentration of last names in your family tree. I recommend you save this information as a spreadsheet so you can do more with the data. Click the Export menu and choose Individuals to Excel. This will give you tons of facts. You may want to delete most of the columns.

Dive deeper into each of your ancestors' last names using the Family Tree Analyzer Surnames report.

3. Excel's Charting Features

The spreadsheet I saved from the FTM Surname Report works best for creating charts. It includes the all-important count for each name. The FTA Surnames Report lists each name entry separately. You'd have to do some manipulation or manual counting of each name to get enough data to make a chart.

I chose the Count column in my spreadsheet and sorted the data from Largest Count to Smallest Count. At the bottom of the list I have a lot of names that appear only once or twice among my direct ancestors. I decided to include only the names that appear 5 or more times. I selected the surname and count of each entry with 5 or more in the Count column. For me, that's a total of 29 different last names.

Click Recommended Charts on the Insert tab, and then choose All Charts. This gives you a preview of how each chart will look with your data. I chose an Area chart, and then I fiddled around with the options until I liked the results. I created a pie chart, too.

Examining Your Results

My maiden name is Iamarino, but I'm still a little surprised to see that name come out with a commanding lead. All the other names scoring double digits are surprising to me. Coming in at #2 is Pilla, which happens to be the name of my Grandpa Iamarino's mother. It's also a common name in many of my ancestral towns. But I had no idea how many of them were my direct ancestors. It's also exciting to see that my earliest known Iamarino ancestor was born in 1640. That's a remarkable find for someone with roots in Italy.

As you examine your list of last names, which ones do you think you'd like to take a step further? Why not make a poster of everything you can learn about your top surnames?

I’m lucky to have a book that explains the history of last names in Italy. It's a huge book because Italy has the highest number of last names in Europe at about 350,000. (See "The Interesting History of Italian Last Names.") There may be such a book for your ancestral places. Explore Google Books or an online library catalog for your options. If you're Italian, the book I have is available online for free. Go to https://archive.org/details/OrigineEStoriaDeiCognomiItaliani.

From this cognome or last name book, written by Ettore Rossoni, I learn that the name Iamarino:

  • is very rare
  • comes primarily from Colle Sannita (my grandfather's hometown)
  • means the son of Giovanni (or Gianni) Marino
  • is recorded in Colle Sannita as early as 1588

Does your ancestral hometown have a website? What can you learn about the history of the place that's interesting to you?

Years ago I made the surprising discovery that the patron saint of Colle Sannita is Saint George. For some reason, I chose St. George and his April 23rd feast day as a key feature in the novel I wrote as my college thesis. The title of my novel was "St. George." I mean, what are the odds?

I'm also intrigued that the Saracens occupied the town in 728 AD. My maternal grandmother's name was Sarracino. The cognome book tells me this name was once given to Arab or Islamic communities in Italy. Grandma's roots come from a town not far from Colle Sannita. They may be very ancient roots!

Pick out a few details about your ancestral town's origins. Find a nice image of the town or use the map. Put something together in Word or other software that you might turn into a book cover or a framed wall hanging.

The last names in my family tree give me so much joy. I'm always thrilled to discover a new one. Many of them pin me firmly to one place on the map, like Iamarino.

Step back from your usual research and dive into the most important names in your family tree. You may feel more pride in your heritage once you take a closer look.

25 April 2023

5 Ellis Island Videos Dispel Immigration Myths

Some family history myths never seem to die. Perhaps the biggest one is "my ancestor's name was changed at Ellis Island." Despite what you see in "The Godfather" or its parody "Mafia!" (where they rename an immigrant boy Vincenzo Armani Windbreaker), it didn't happen.

Ask yourself this. When you board an airplane, does the airline know your name and home address? Yes, they do. If you board a cruise ship, does that company know who each passenger is? Absolutely yes.

In fact, they recorded everyone's details at the port of departure and gave them a basic inspection. It was in the shipping company's best interests to turn away anyone who would be rejected in New York. Why? Because the company had to pay the return fare for any rejected immigrant.

East Coast Immigration

Visit the Ellis Island Foundation online to see 5 videos that detail your ancestor's immigration experience. Here are some of the key points from these educational and informational videos.

1. The immigration process is much more difficult now that it was when your grandparents arrived. For the most part, all you had to do was arrive, have a place to go, and not have a contagious disease. The entire process happened within hours.

2. The medical inspection lasted a few seconds. The staff had an average of 6 seconds to look at an immigrant and decide if they were healthy enough. They checked for one contagious eye disease called trachoma that was a big problem at the time. To do this, they had to turn the immigrant's upper eyelid inside out to look for bumps. If the person was sick, they might stay in the building's dormitory until they recovered.

During the Ellis Island years, European immigrants went through a relatively speedy entry process.

3. Ships had a manifest with each passenger's name and information when they arrived. They turned the manifests over to the Ellis Island officials. In the Great Hall of Ellis Island, people waited in line for hours to speak to an inspector. Translators were there to assist. The inspectors asked questions to see if a passenger's answers matched what was on the ship manifest. They asked questions like, "Where are you going?"

4. About 1 in 10 immigrants also had to go before a board of special inquiry. They had to wait in the dormitory for their hearing. After answering several more questions, the majority passed and went on their way. In fact, Ellis Island denied entry to only 2% of immigrants.

Of course your ancestor came here legally. It was so easy to do.

West Coast Immigration

The Ellis Island videos mention that their immigrants came from Europe. Asian immigrants arrived at the Angel Island Immigration Station in San Francisco. My husband's Japanese ancestors arrived there. Recently I found the manifest showing his grandmother Hanako's detention at the facility.

Asian immigrants faced a longer, tougher entry process at Angel Island in San Francisco.

I found her on a page filled with woman who had 2 things in common:

  1. Many had a rubber stamp next to their name that says Photograph Marriage. We all believed Hanako was a "picture bride," but she denied it. Now we have this proof as well as what seems to be the actual photograph.
  2. Most of the people on the page had uncinariasis, also known as hookworm. Officials labeled these immigrants as having a "dangerous contagious disease." The people were all detained, treated, and released. Many of the contagious picture brides are also labeled L.P.C.: likely public charge. That seems odd when they had an arranged husband to meet them.

It looks as though they held Hanako for 18 days before her husband took her to her new home.

Immigration was much harder at Angel Island because of prejudice against Asians and the Chinese Exclusion Act. If there were European immigrants arriving in San Francisco, they received preferential treatment. Officials processed their papers aboard the ship so they could disembark and be on their way. This was also true of 1st and 2nd class passengers at Ellis Island.

Unlike Ellis Island, the Angel Island immigration process didn't take hours. It took weeks, months, or sometimes years.

It's important to understand the experience of your immigrant ancestors. I often think of my great grandmother Maria Rosa, who made the 3-week voyage while she was 6 months pregnant. It sounds nauseating! Or my grandfather Pietro, who arrived at age 18 after somehow getting from southern Italy to a port in France. Or my grandfather Adamo, who first arrived in 1914 as a 23-year-old, but had to return to Italy to fight in World War I for the Italian Army.

They all made long, difficult journeys, and most seemed to decide to never speak about it again. Take some time to understand the journey your ancestors made. You know you owe everything to them.

To learn about the Ellis Island immigration process, view the 5 videos at https://www.nps.gov/elis/learn/education/eie-series.htm.

To learn about the Angel Island immigration process, see the History Channel page at https://www.history.com/topics/immigration/angel-island-immigration-station.

18 April 2023

Where Will Your Roots Map Take You?

A couple of years ago I was looking at a map I bought while on vacation in Italy. I realized all my ancestral hometowns fit into a small area of the map. My roots are extremely concentrated. They're all in one province (that's like a county in the U.S.), with one exception that's just over the border.

Here's the part that amazes me. My grandparents and one set of great grandparents met and married in America. But their roots were in neighboring towns in Italy. You may have similar stories in your family tree. Of course immigrants felt comfortable in neighborhoods where everyone spoke the same language. And they felt even more comfortable when their neighbors spoke the same dialect. Imagine how much that helped them make the transition to their newly adopted country.

Generating Your Roots Map

This week I wanted to see a visualization of not only my ancestors' towns, but all their birthplaces on the map. I turned to a program I tested 2 years ago: Microsoft's Power BI Desktop. (BI stands for Business Intelligence.) If you want to try this, see the 5 steps further down in this article. But here's how easy it is to create the map once you're in Power BI:

  1. Click the Map icon (which looks like a globe) and expand the graphic to fill the workarea.
  2. Drag the FactType field into the Filters column and check Birth in the list.
  3. Drag the SortableLocation field and drop it in the Location section of the Visualizations column.

Those 3 steps gave me 18,947 blue dots on my world map. (That's how many people are in the GEDCOM file I'm using.) I see a ton of dots covering the New York City area and scattering over to the Midwest where Dad was born. Italy is positively overrun with blue dots.

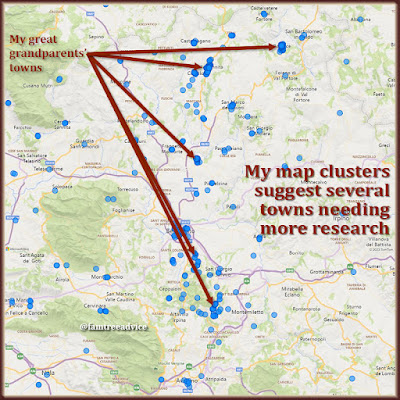
Each datapoint in your family tree can generate more research leads.

I can use the scroll wheel on my mouse to zoom in on Italy. There I can see a huge cluster of blue dots from Naples in the west to Foggia in the east. I love this visual. This is the cradle of my civilization.

If you'd like to create this map for your roots, all the software is free. The only caveat is you must be using a Windows computer. Here's what to do:

  1. Download and install the free Microsoft program at https://powerbi.microsoft.com/en-us/desktop.
  2. Export a GEDCOM from your family tree program or website. You may want to filter your export to your blood relatives (your ancestors and all their descendants) or only your direct ancestors.
  3. Open your GEDCOM with Family Tree Analyzer (https://ftanalyzer.com) and choose to Export Facts to Excel. (It will actually be a CSV file.)
  4. Open the CSV file to see if there are any columns you don't want. I noticed start date and end date columns, and 2 columns up front, that I decided to delete. Save your changes.
  5. Launch Power BI Desktop and choose to Get Data from your CSV file.

Now you're ready to create your map by following the 3 steps I outlined at the top of this article. It makes me proud to have such a tight cluster of roots. Having clusters all over the world might make your existence more of a miracle.

Following the Trail Wherever It May Lead

My Italian cluster is why I spend all my time indexing and exploring vital records from these towns. Even if someone is in my tree due to marriage only, they are me. They're all me.

I'm even expanding into other neighboring towns. I was trying to track down the family of a DNA match when I realized her ancestor's last name exists in the next town. I started scouring that town and found her ancestor's 1842 birth record. And I saw a handful of familiar last names there.

The nearby dots, towns next to your ancestral towns, hint at future family tree research.

I have more than enough towns and data to keep me exploring and discovering for the rest of my life.

Are your map clusters telling you to research a new town? Look for nearby dots on your map. Maybe your ancestor married someone from the next town. It may be time to expand your search.